

Review analytics
Analytics is an organization-admin dashboard that summarizes flow usage over a time range: volume, run outcomes, triggers, time saved, and failures. Studio embeds the dashboard on the Analytics page. Data refreshes about every hour. Screenshots on this page show how to open Analytics and the main dashboard views.
When to use
Section titled “When to use”- You are an organization admin and need a high-level view of automation usage or reliability.
- You want to compare run volume, failure rate, or time saved across flows for a period.
- Prefer Logs on a specific flow when you need a single run’s steps, filters, or Rerun.
Before you begin, you need the organization admin role on the current organization. Other roles do not see Analytics (or are redirected away from the page).
Open Analytics
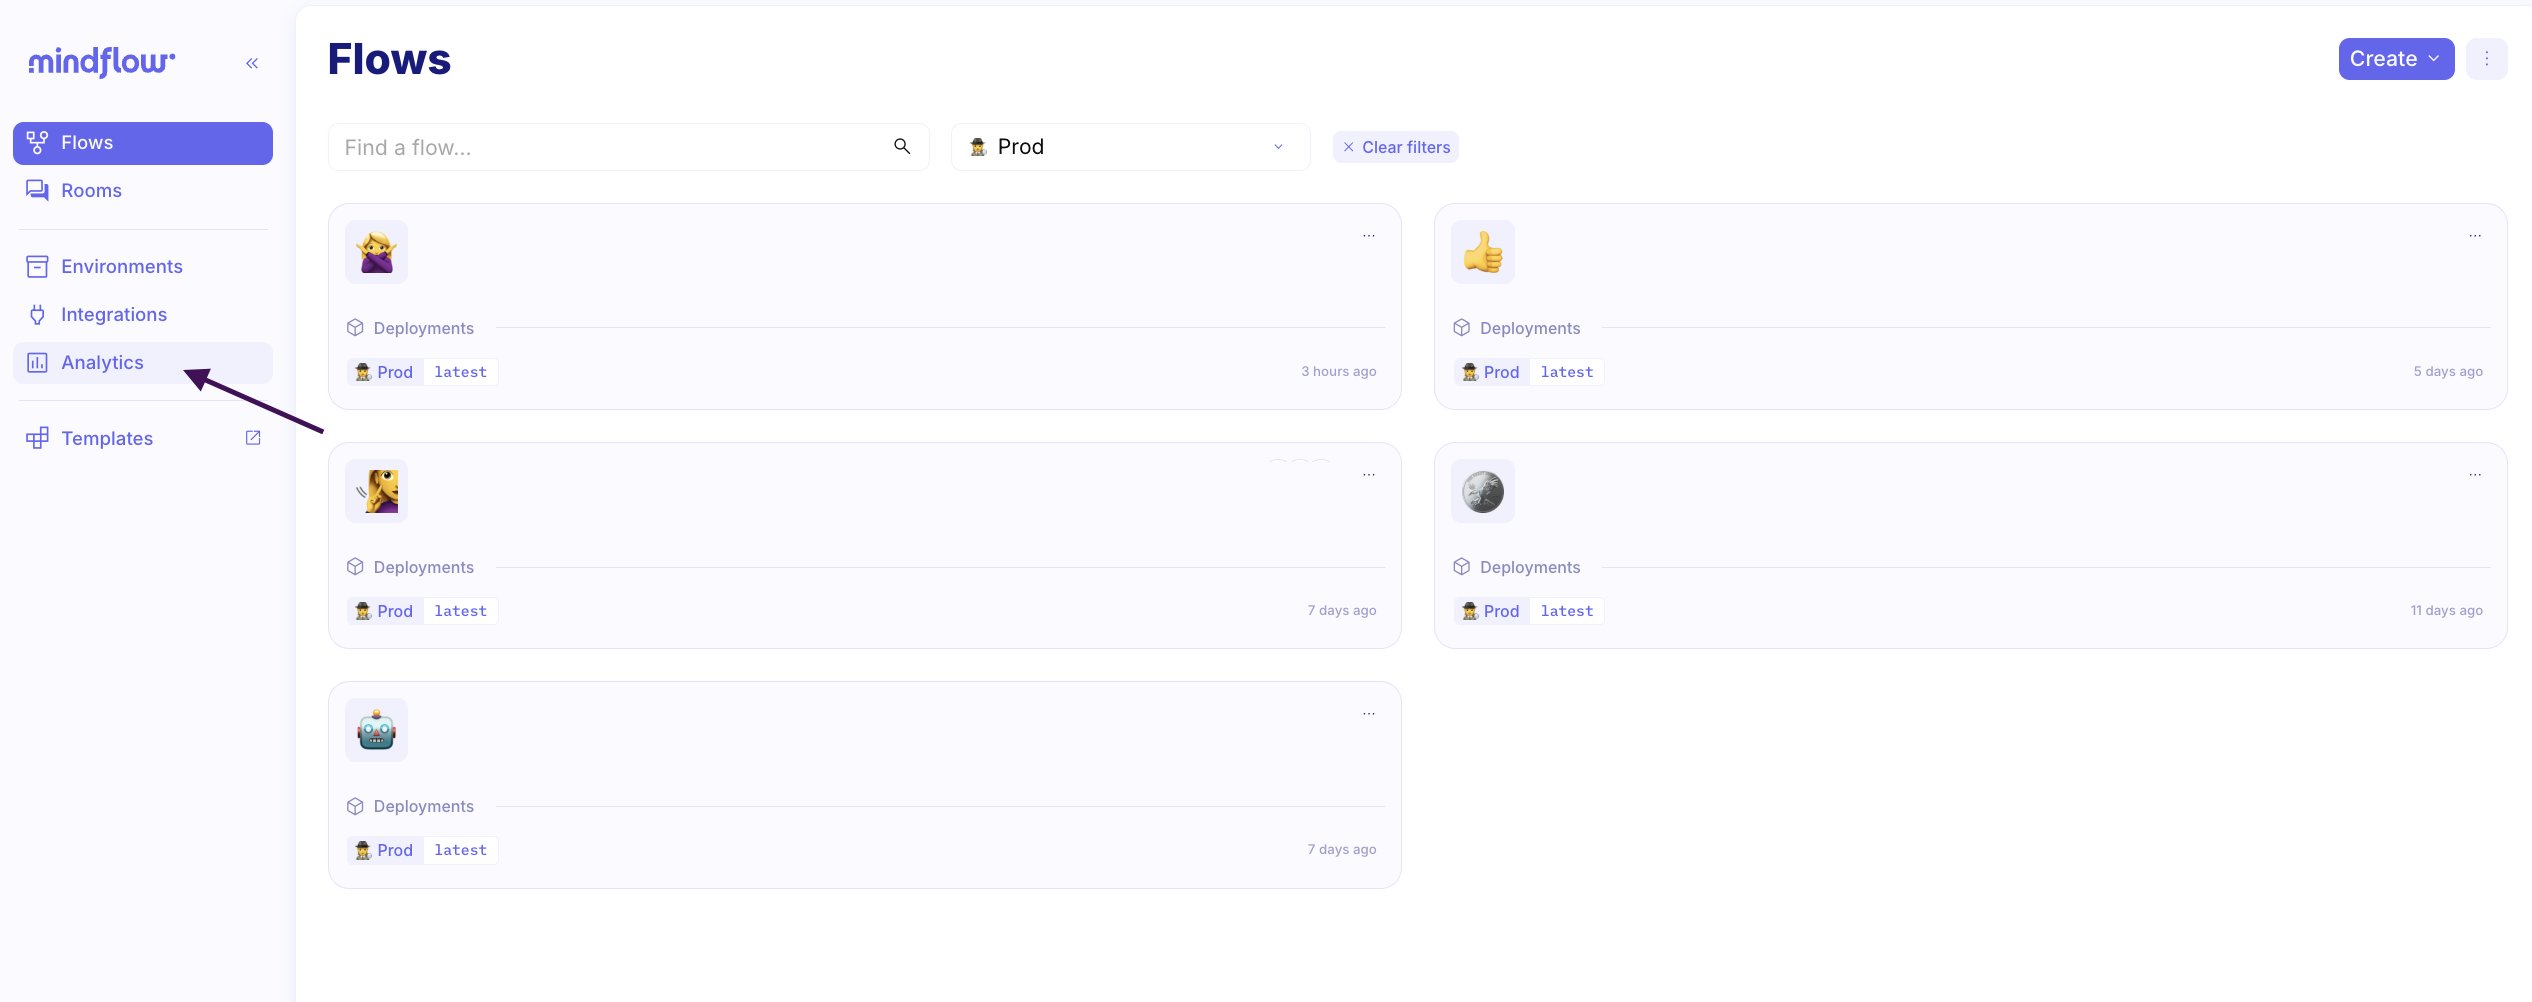
Section titled “Open Analytics”Organization admins open Analytics from the Studio sidebar under Govern.
Open Analytics. In the left sidebar, under Govern, select Analytics. The page title is Analytics, with a note that data refreshes every hour.
Filter the dashboard
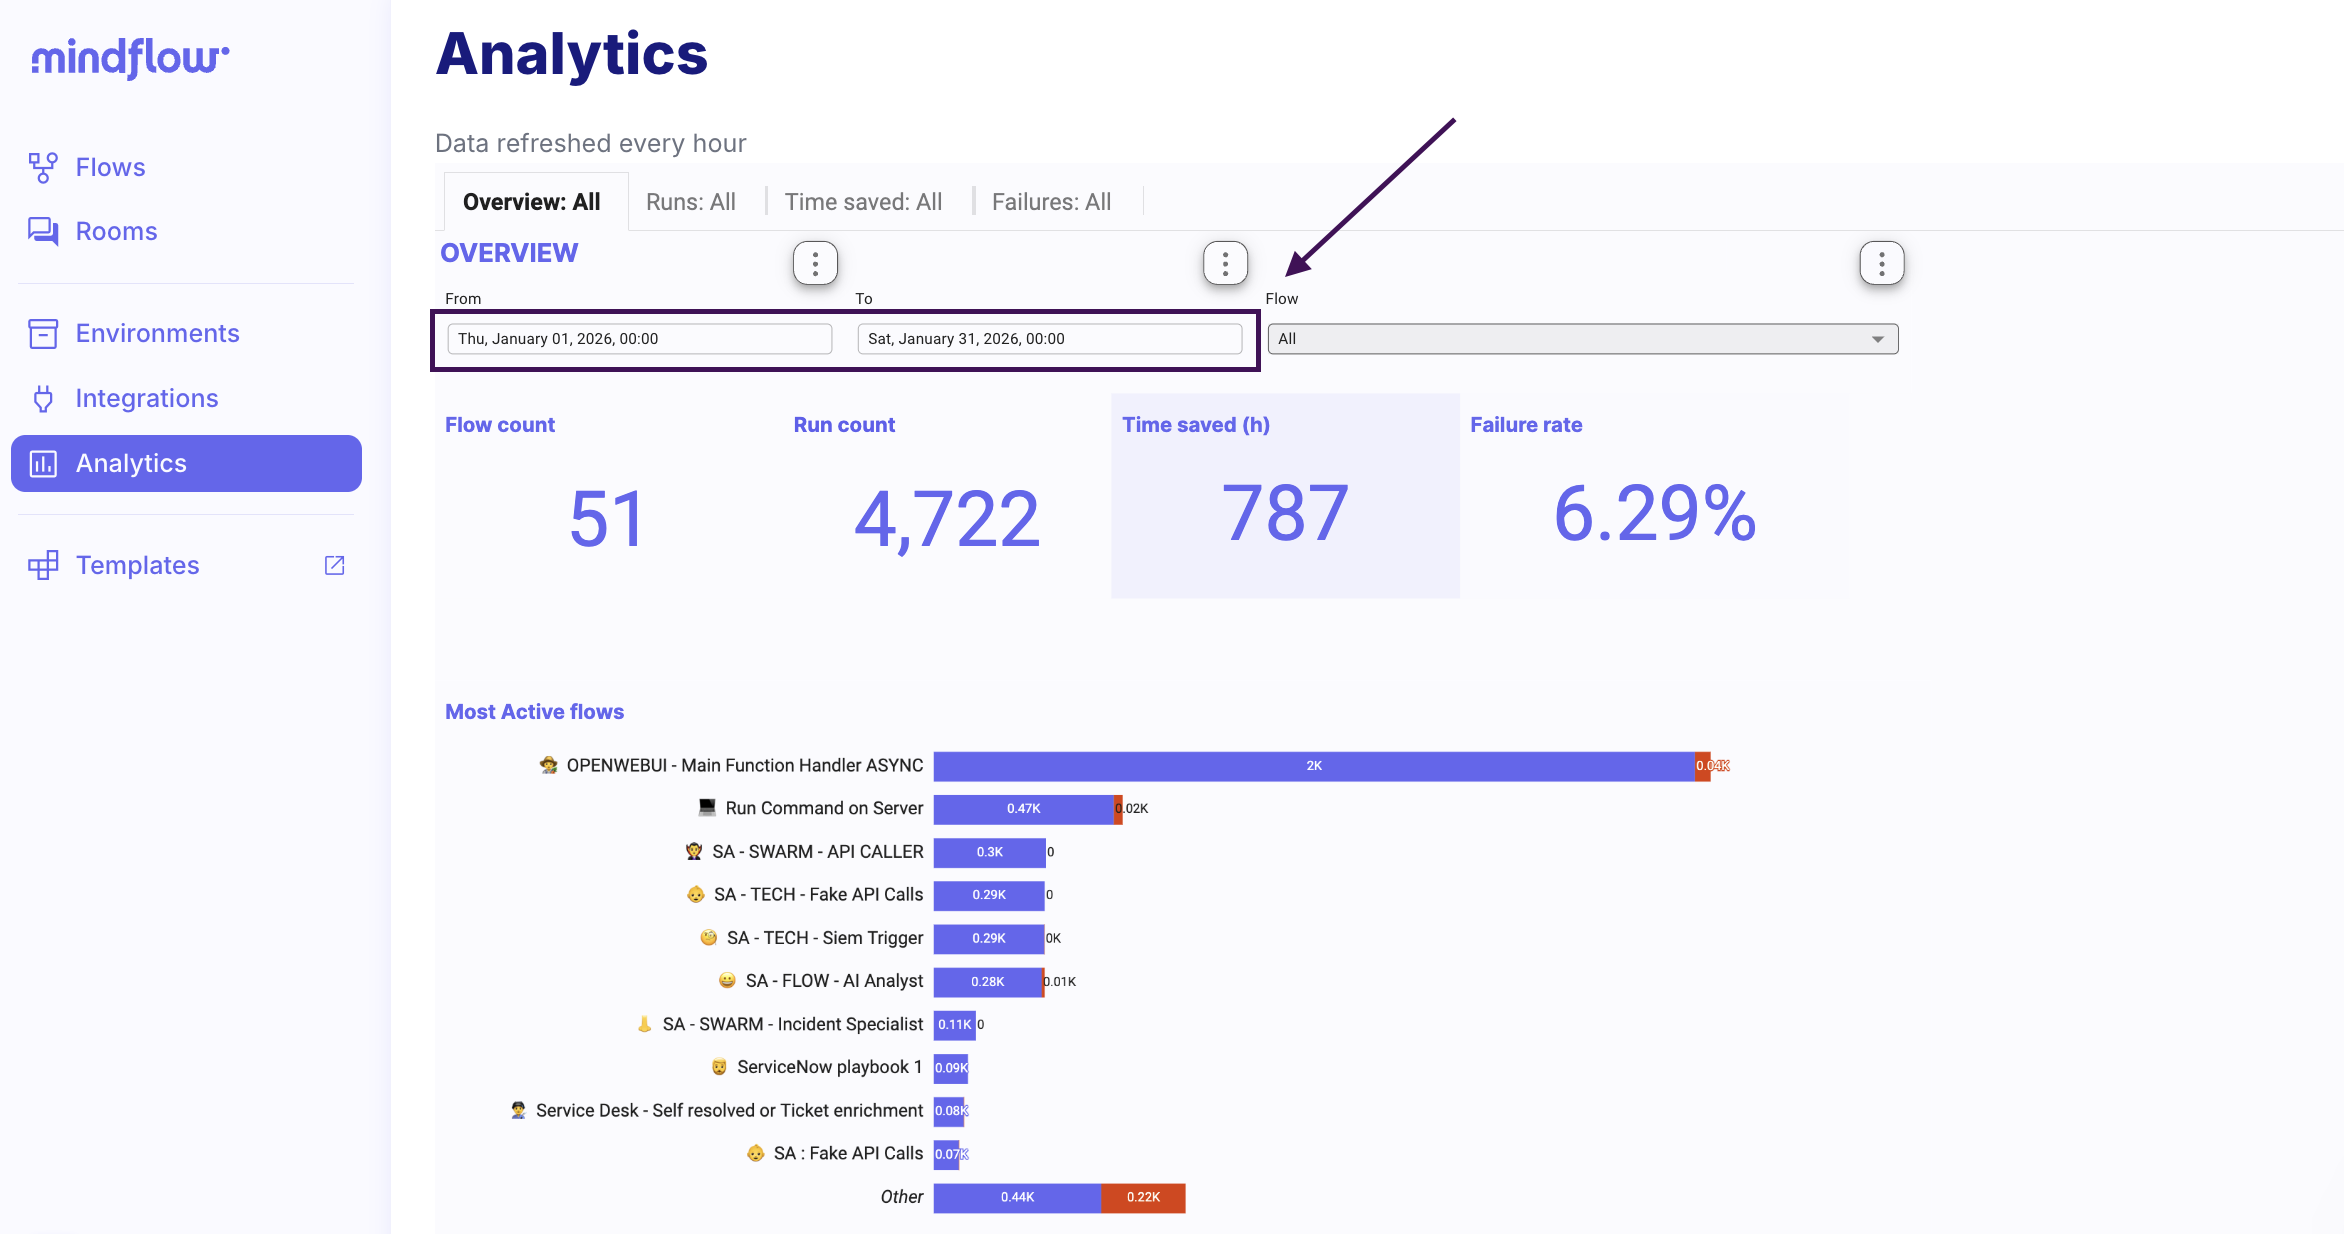
Section titled “Filter the dashboard”The embedded dashboard lets you narrow the charts by date range and by flow. Dates in Analytics use UTC.
Set the range and flow. Choose From and To, and optionally pick a flow instead of All. Charts and tables update for that filter.
Use Overview
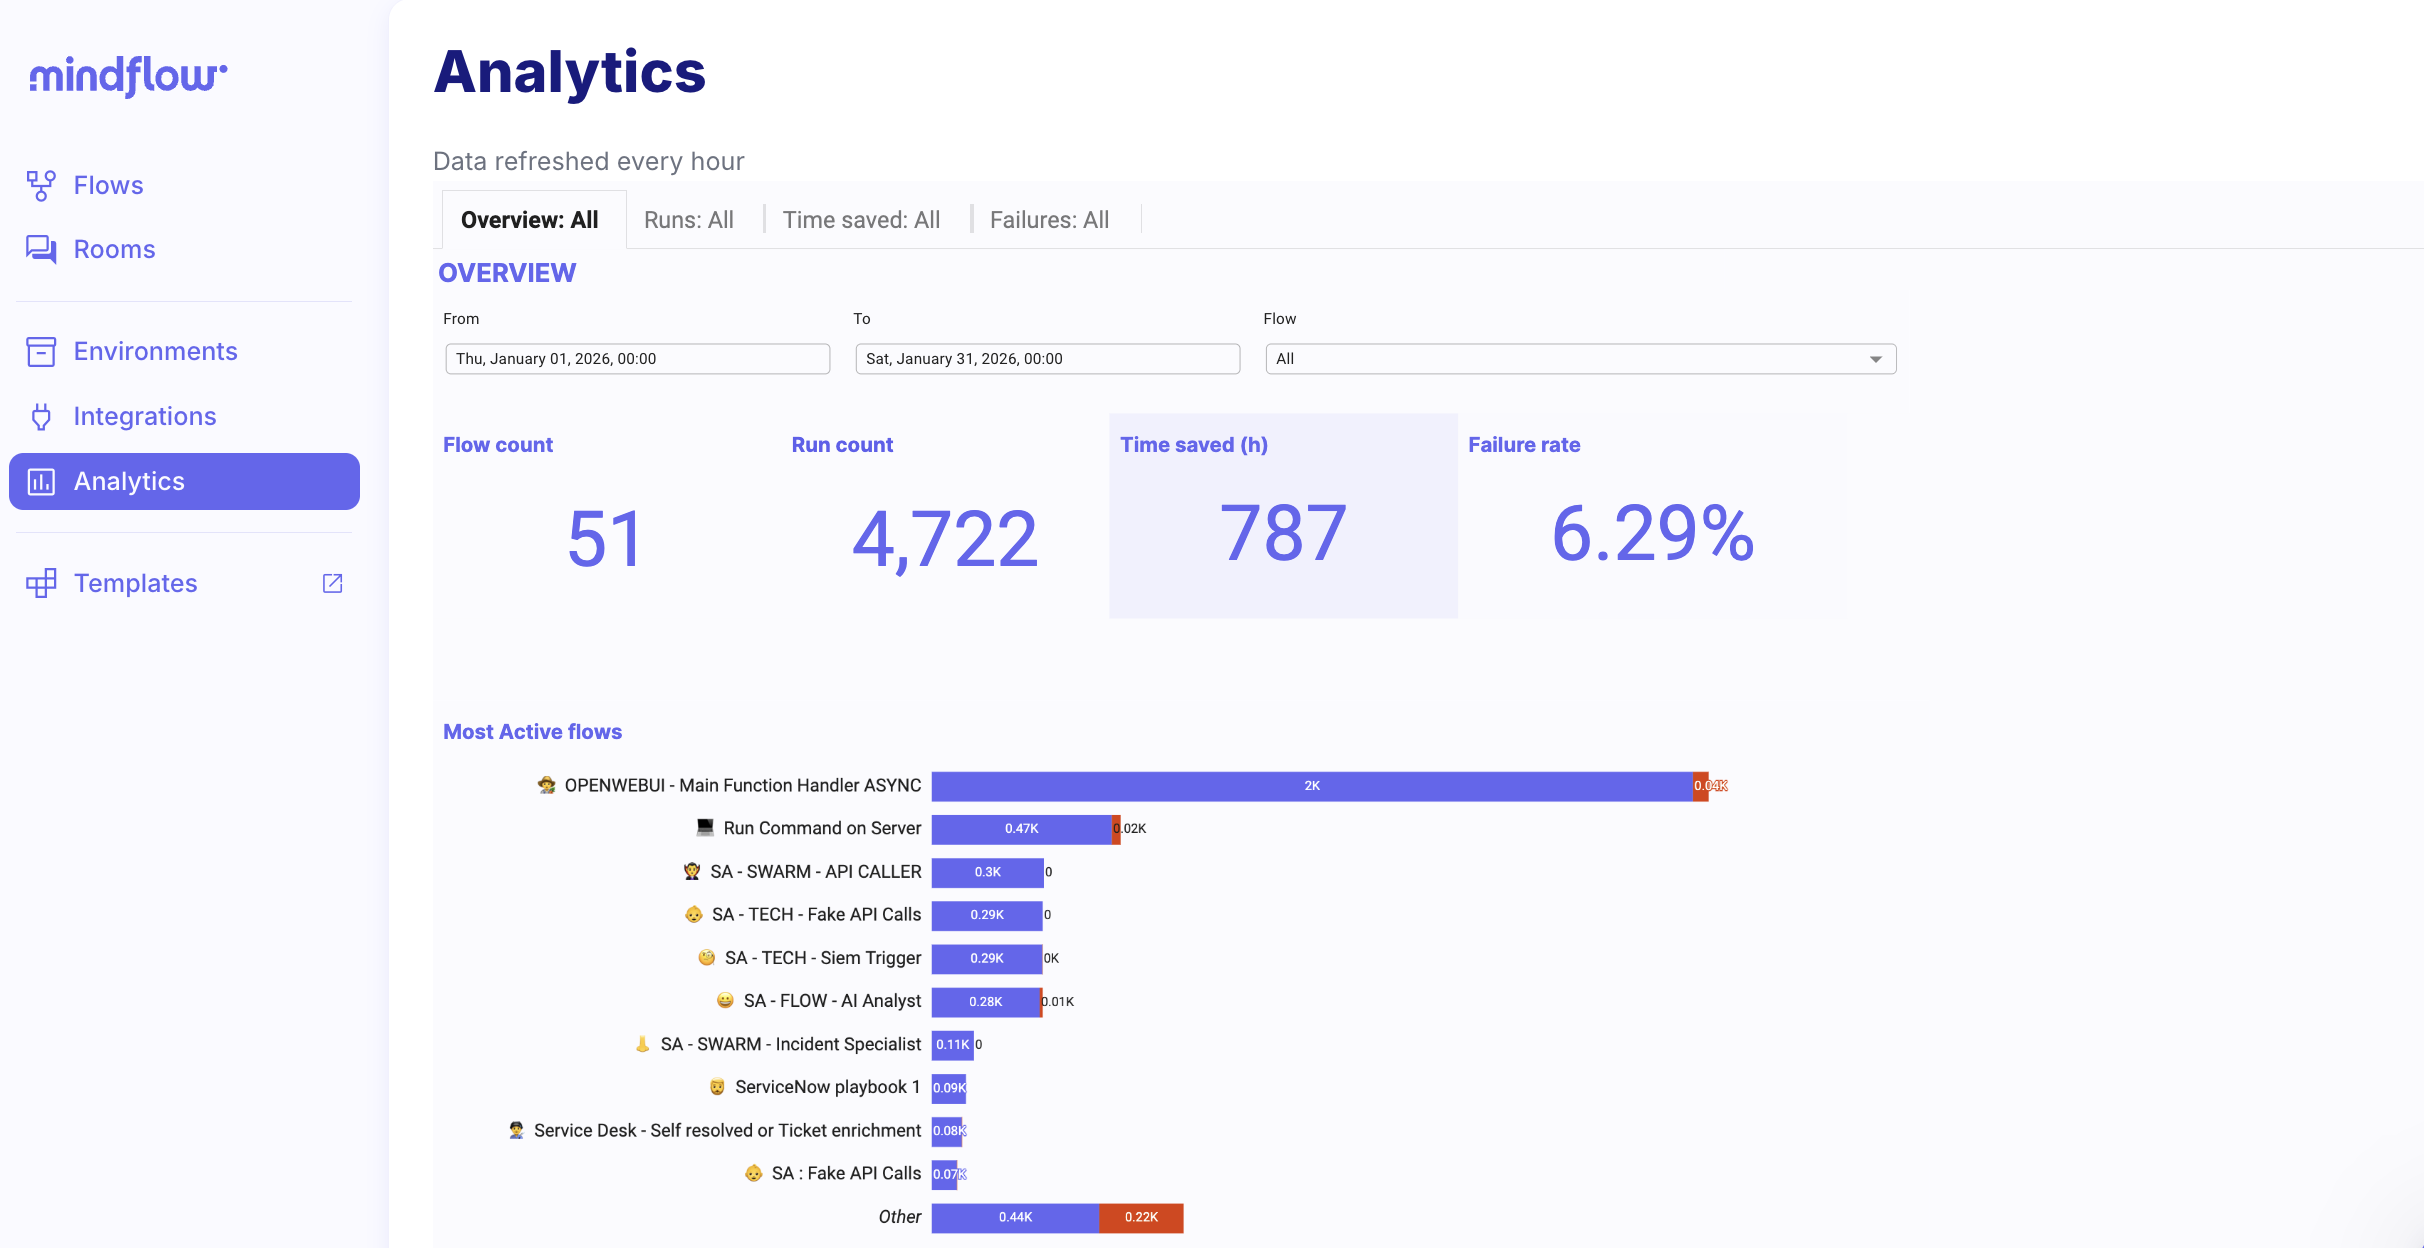
Section titled “Use Overview”Overview summarizes platform impact for the selected period: flow count, run count, time saved, failure rate, and the most active flows.
Open Overview. Select the Overview tab and review the KPIs and Most Active flows chart.
Use Runs
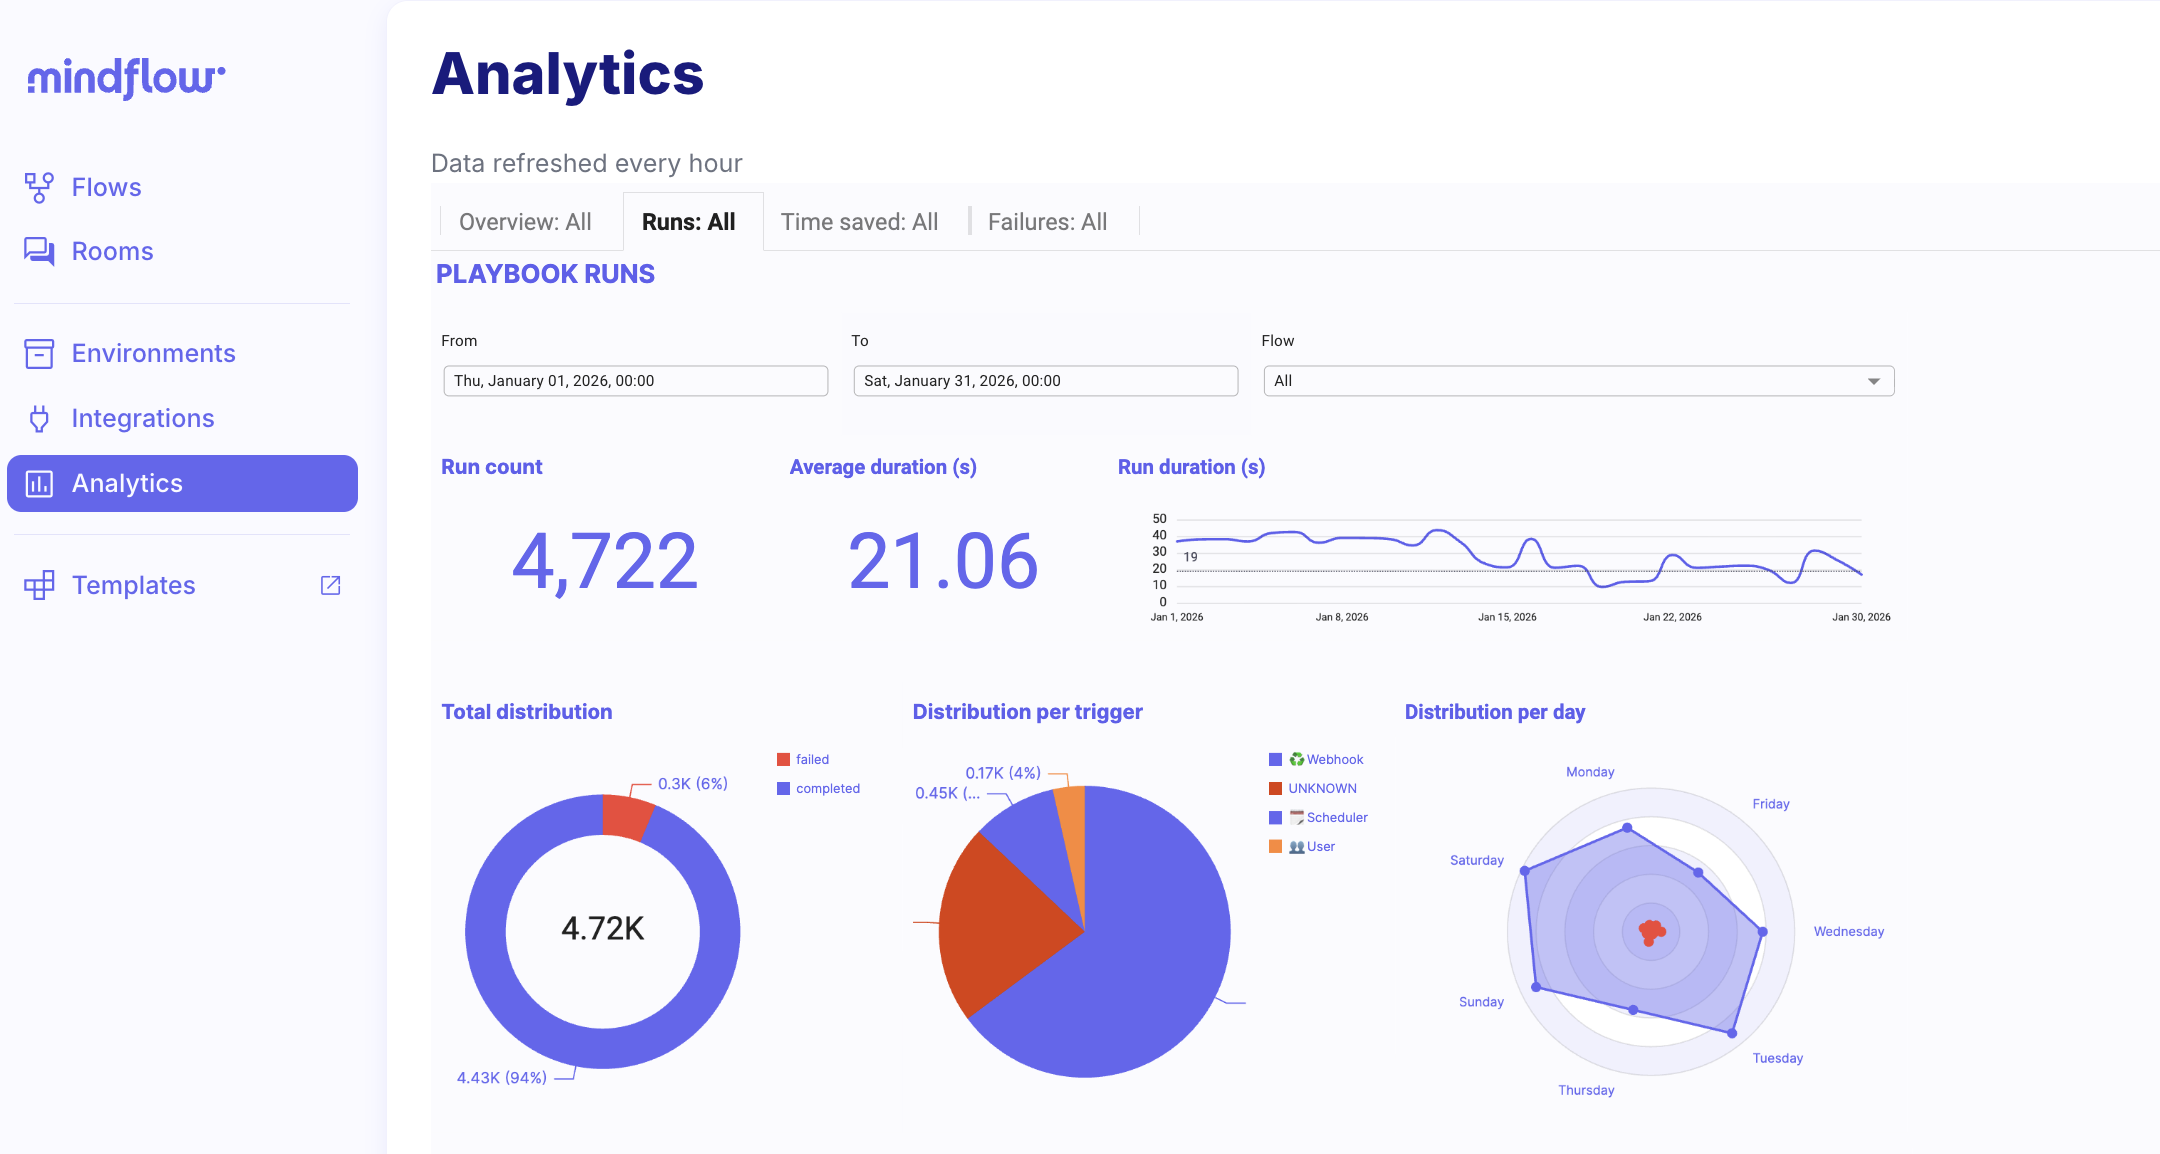
Section titled “Use Runs”Runs focuses on execution volume, duration, status mix, trigger sources, and activity by day of week.
Open Runs. Select the Runs tab to review run count, average duration, completed vs failed distribution, trigger breakdown, and daily activity.
Use Time saved
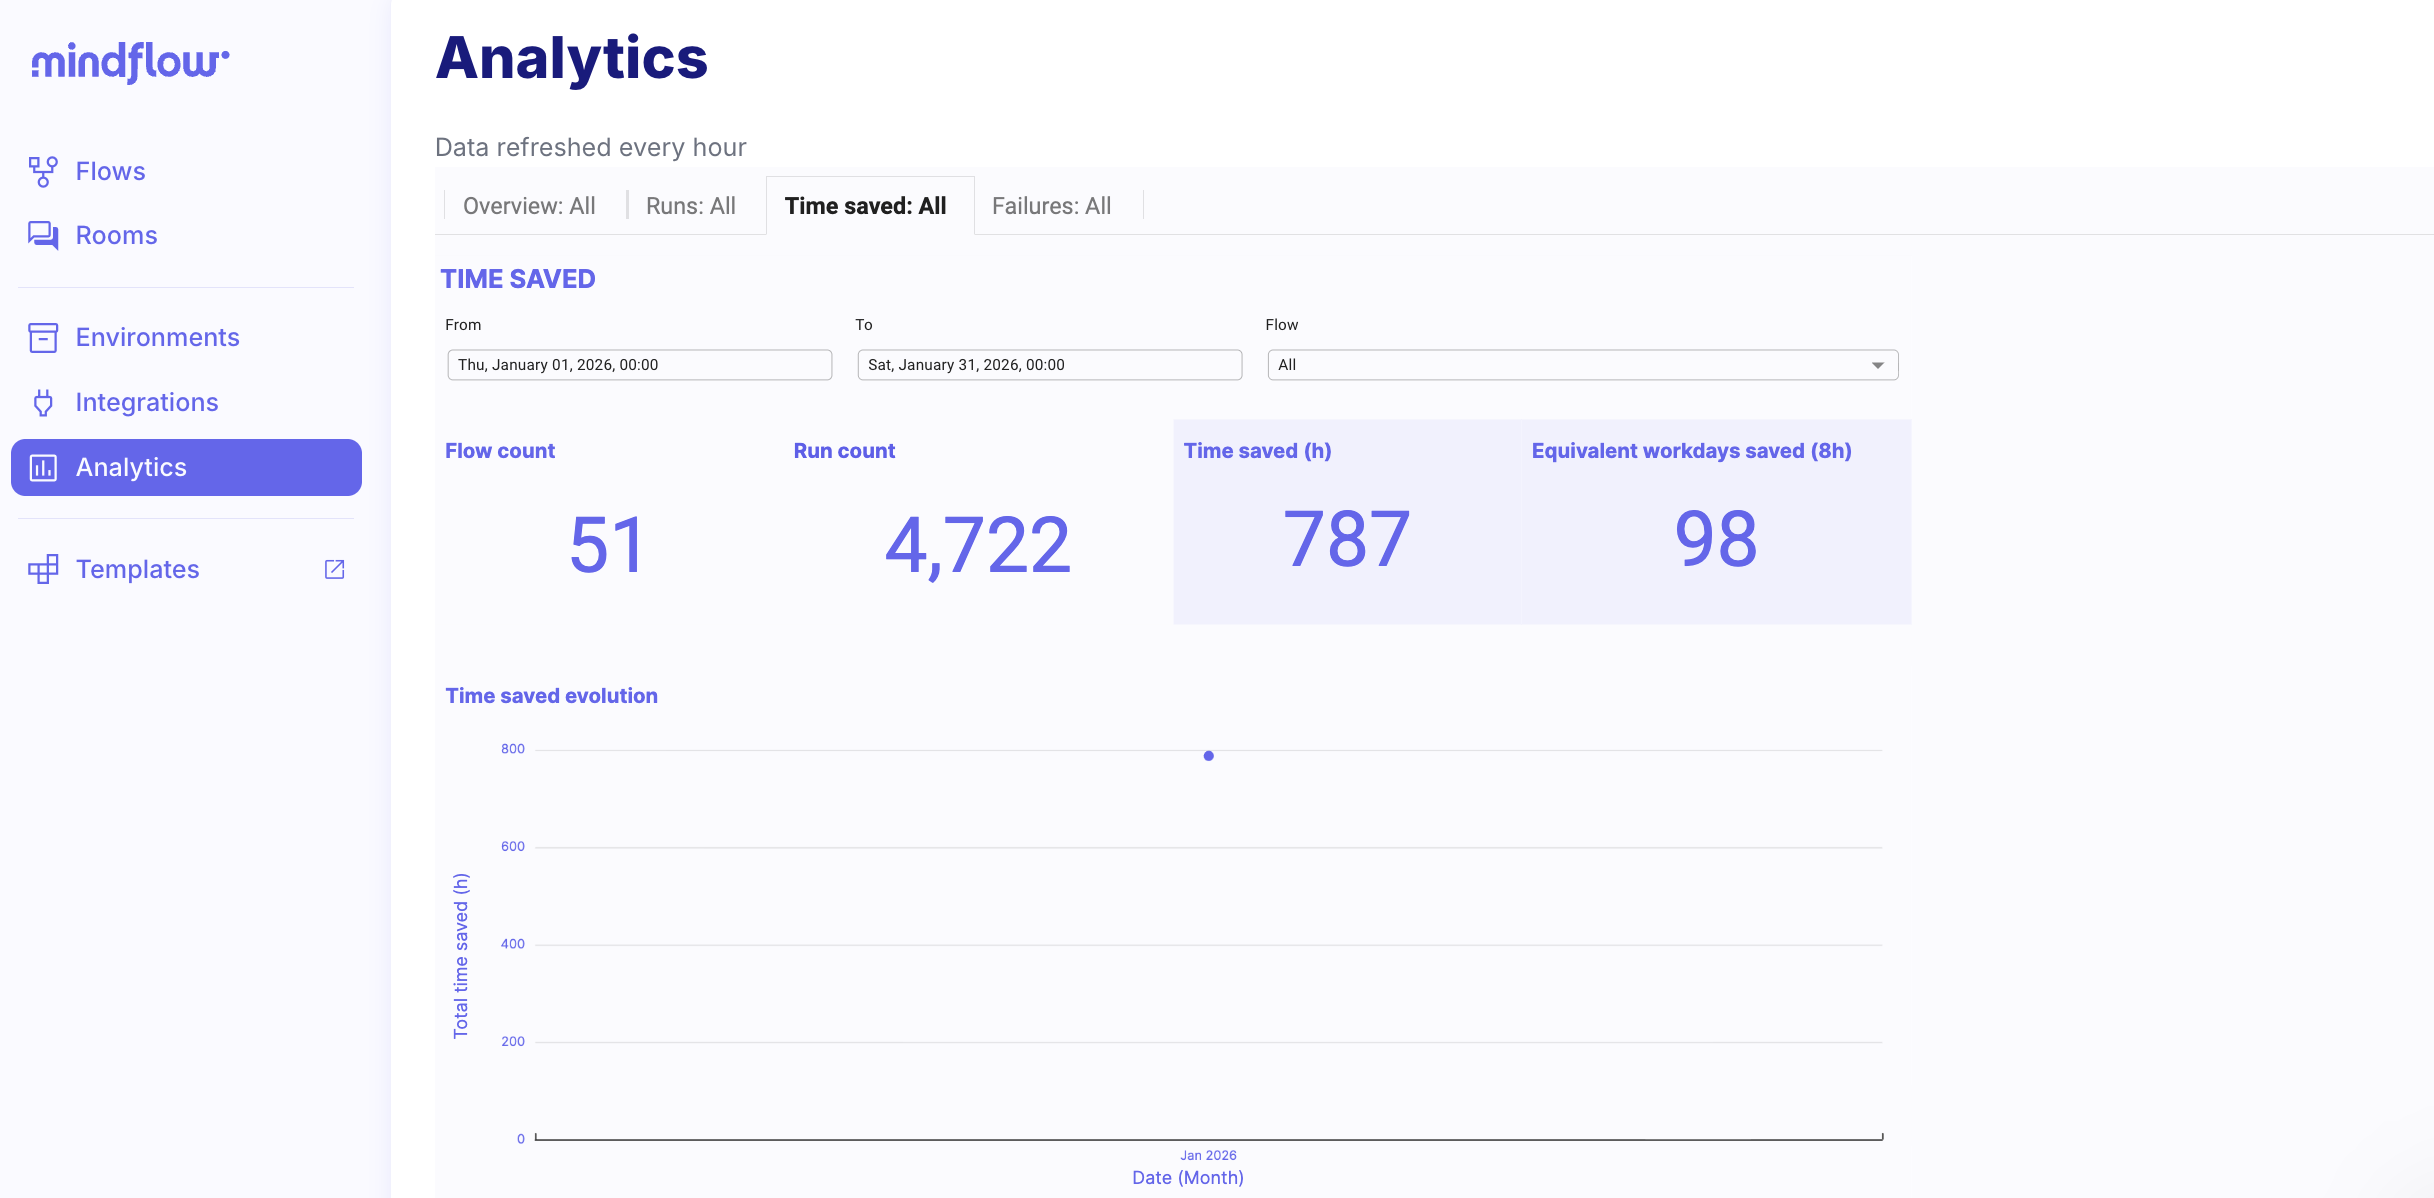
Section titled “Use Time saved”Time saved turns configured time-saved values and run counts into productivity metrics and a timeline of accumulated savings.
Open Time saved. Select the Time saved tab to review hours saved, equivalent workdays, and the evolution chart for your period.
Use Failures
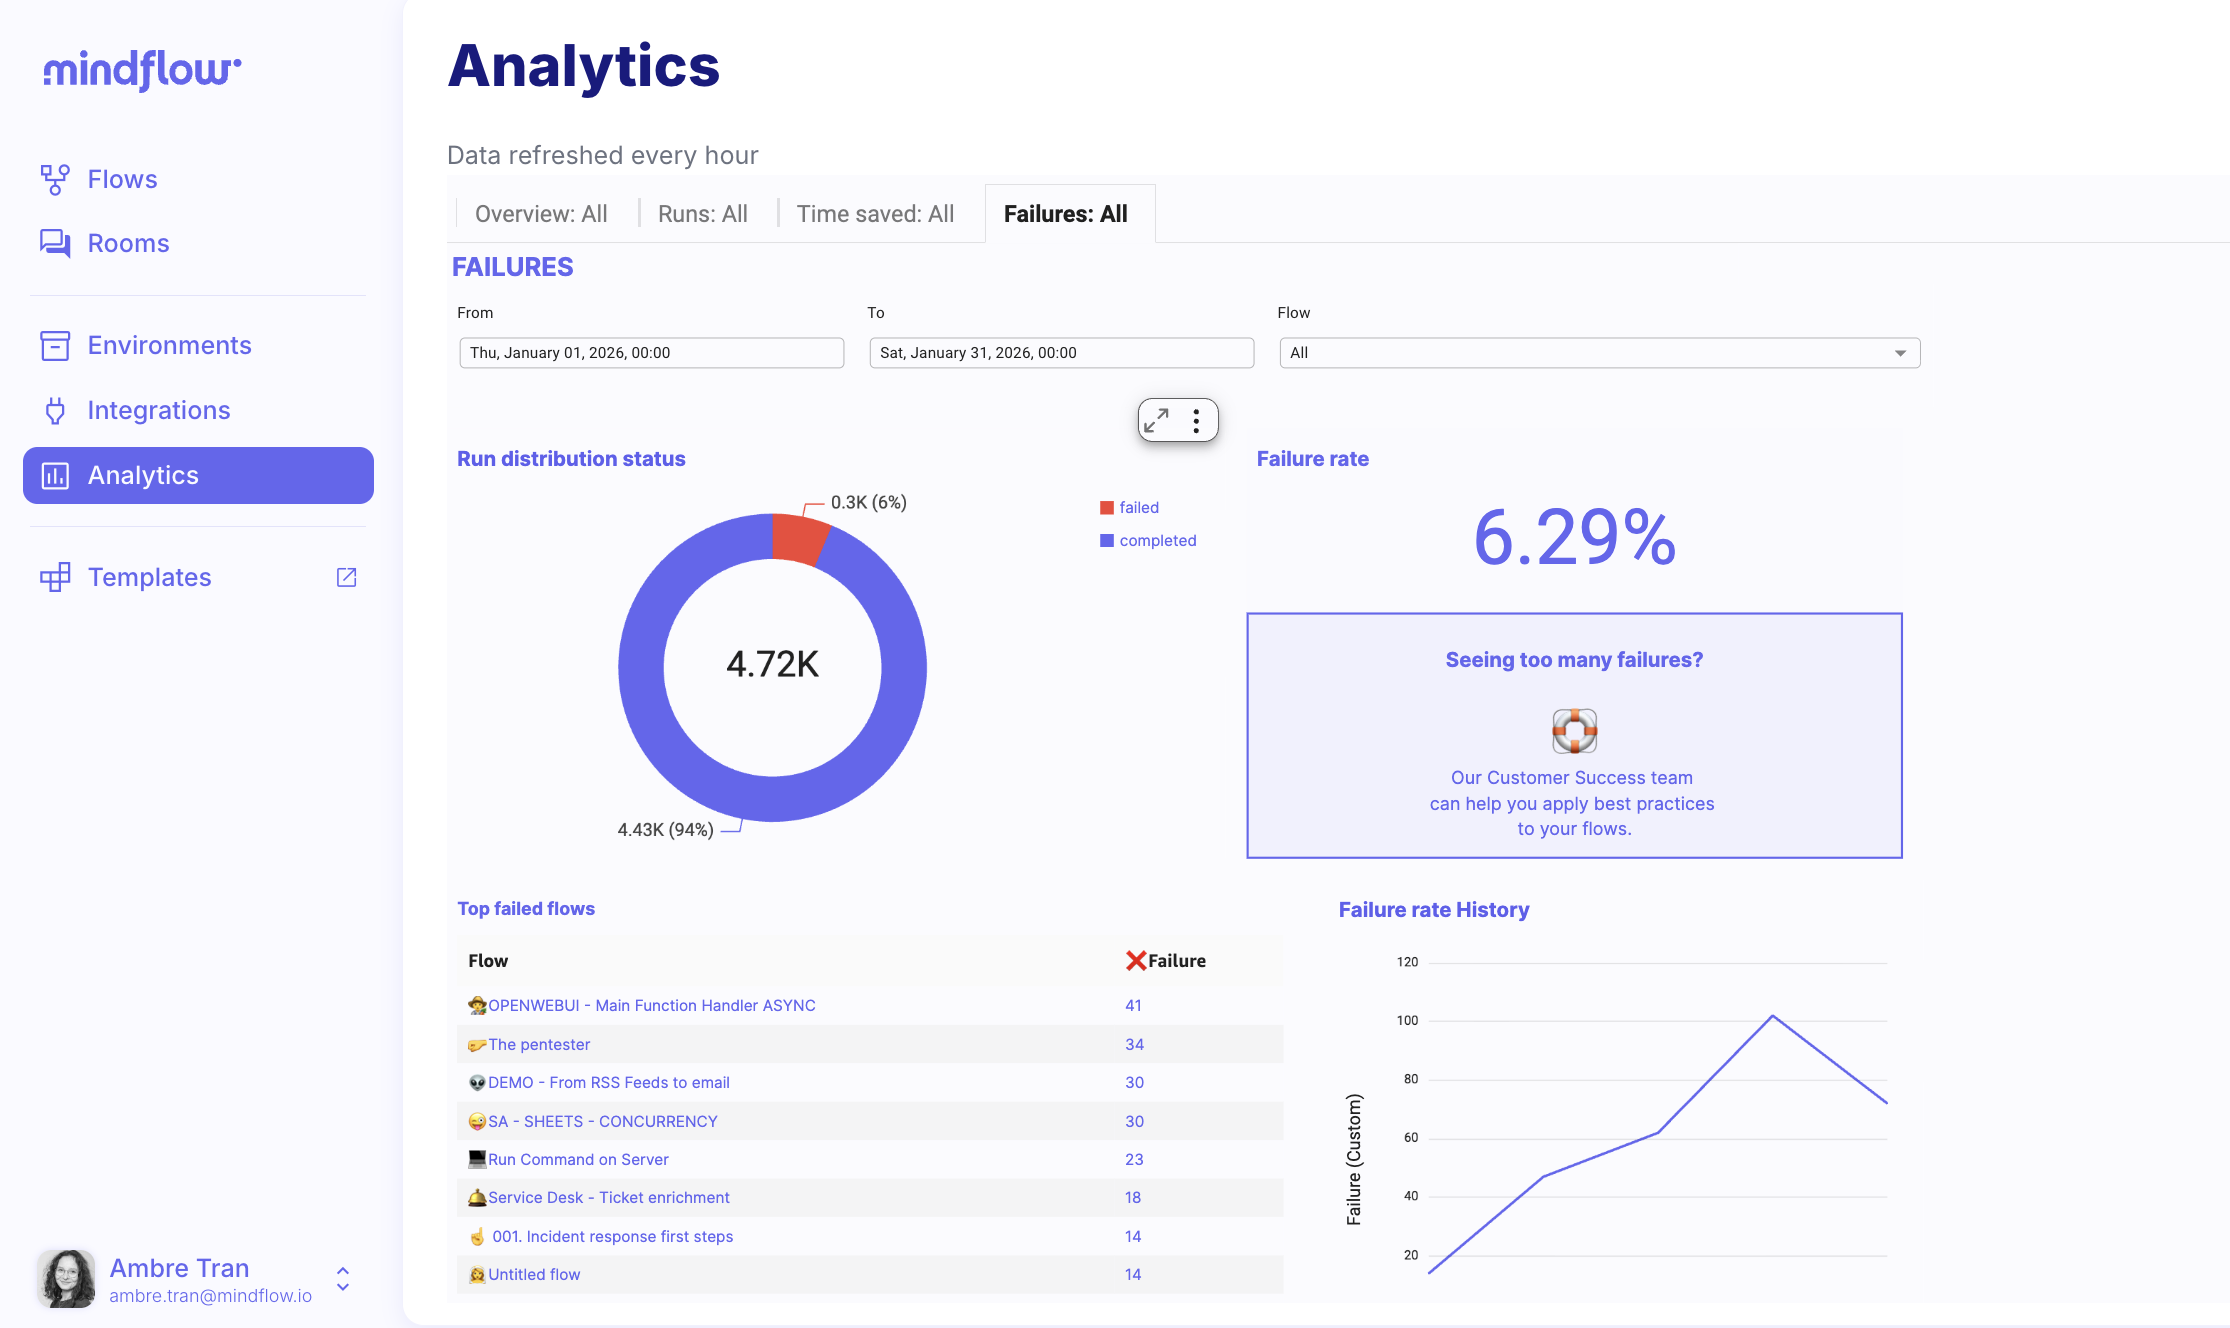
Section titled “Use Failures”Failures highlights reliability: status mix, failure rate history, and the flows with the most errors so you can prioritize fixes.
Open Failures. Select the Failures tab, then use Top failed flows as a starting list for maintenance.
Use AI usage
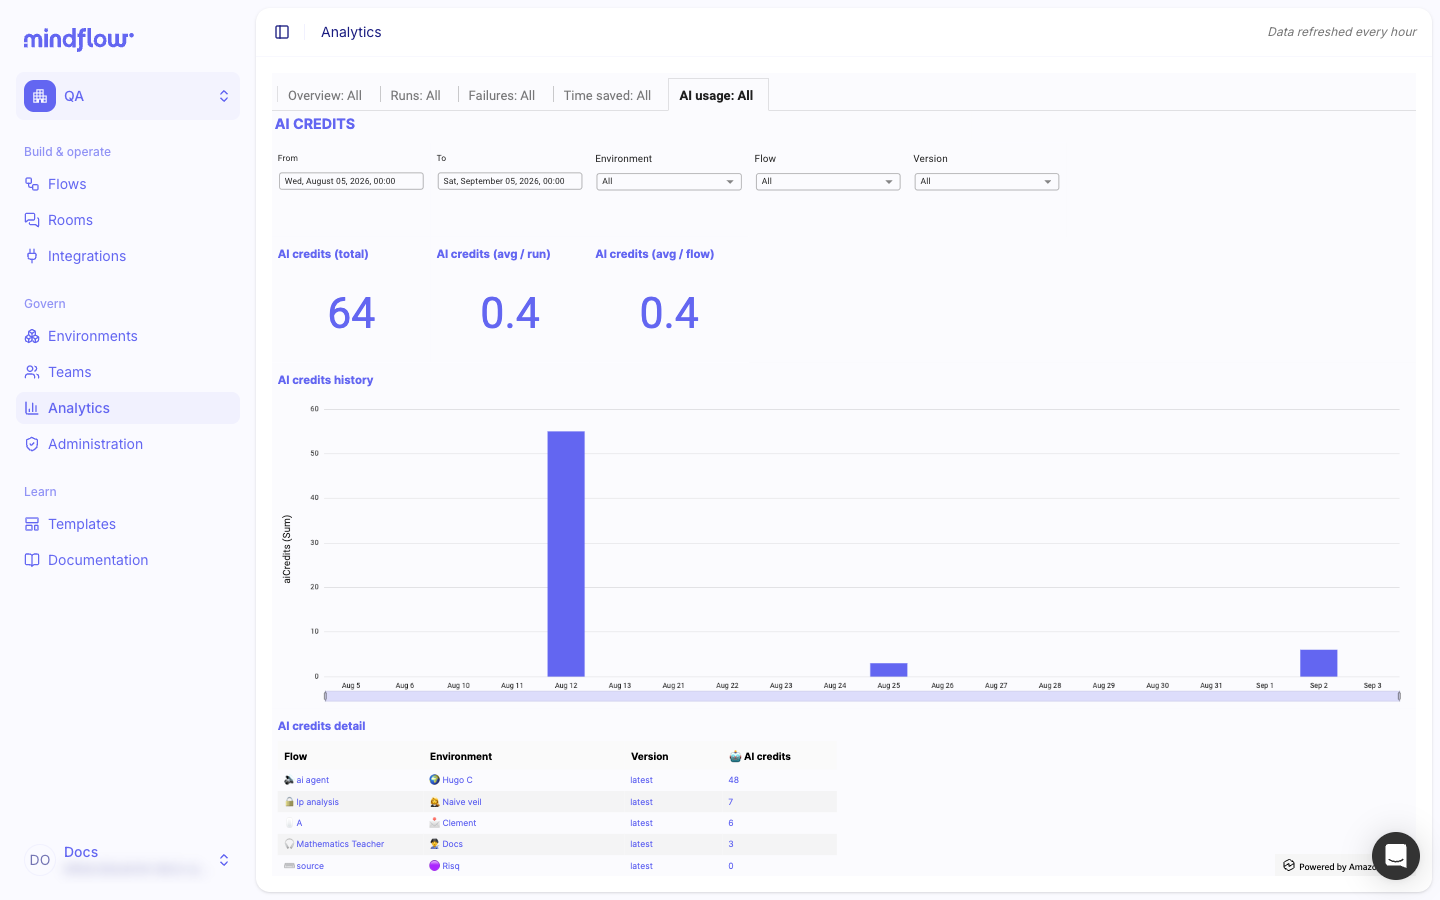
Section titled “Use AI usage”AI usage summarizes AI credit consumption for the selected period: total credits, averages per run and per flow, history, and a credit detail breakdown. Filter by date range, environment, flow, and version.
Open AI usage. Select the AI usage tab to review AI credits totals, averages, history, and detail for your period.
Example
Section titled “Example”An organization admin opens Analytics for the last calendar month, leaves the flow filter on All, and checks Overview for total runs and failure rate. They switch to Failures, open the noisiest flow from Top failed flows, then use that flow’s Logs to inspect recent error runs.
Keep in mind
Section titled “Keep in mind”- Only organization admins can open Analytics.
- Dashboard data refreshes about every hour; it is not a live stream of the latest second.
- Dates in the dashboard are in UTC.