

Inspect flow logs
Logs are the execution records for a flow deployment. They help you see what ran, where a run failed, how it was triggered, and how long it took. Run a flow to follow its execution in the Logs drawer, or open the drawer from the designer to filter and inspect previous runs.
When to use
Section titled “When to use”- A flow failed, returned unexpected data, or ran slower than usual.
- You need an audit trail that an action happened for a given trigger.
- Prefer Review analytics for organization-wide volume and failure trends (organization admins).
- Prefer Report executions by email when stakeholders need status mail without opening Studio.
Before you begin, open the flow deployment in the designer for the environment you are troubleshooting.
Open Logs and filter runs
Section titled “Open Logs and filter runs”The Logs view lists recent runs for the current flow deployment. Filters narrow the list by outcome and trigger type.
Open Logs. In the designer, open the flow inspector and select Logs.
Filter if needed. Use All statuses (or Success / Failure) and All triggers (or a specific trigger such as Webhook). Use Clear filters to reset.
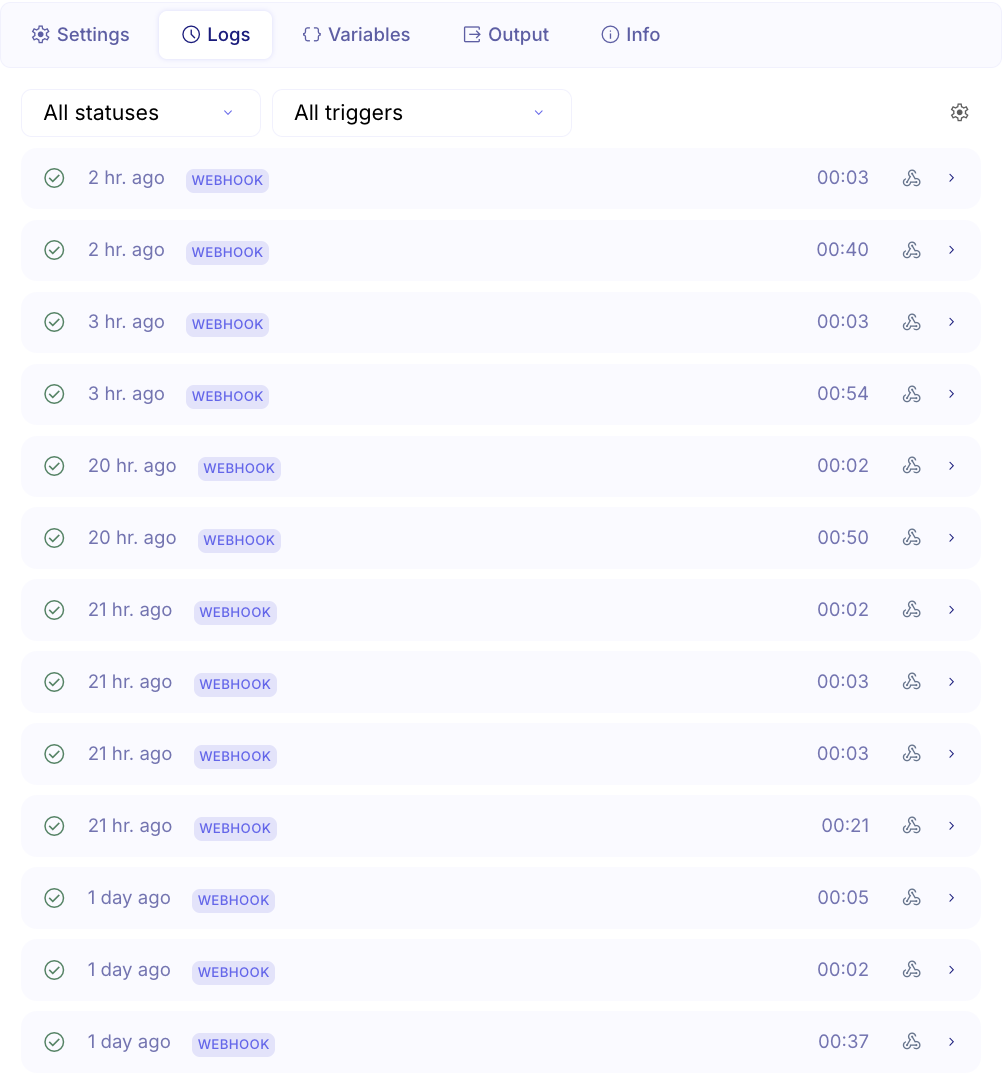
Open a run. Select a log row to inspect its flow log, step logs, timing, and errors.
Follow a live run in the drawer
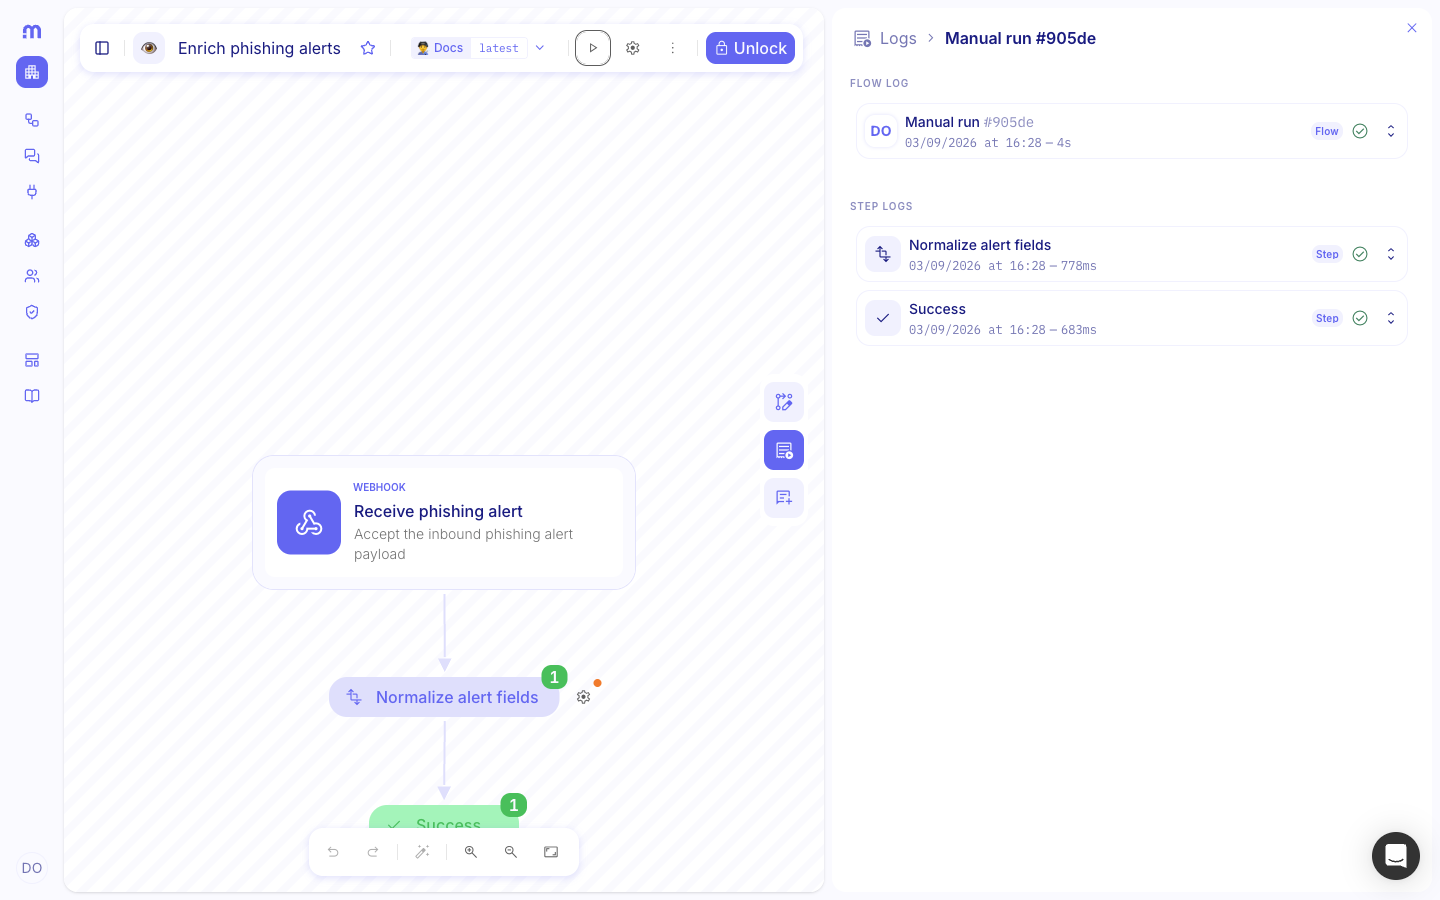
Section titled “Follow a live run in the drawer”When you run a flow from the designer, the Logs drawer opens beside the canvas. It shows the flow log and adds each step log as the run progresses.
Run the flow. Select Run this playbook in the designer toolbar. If Studio asks about previous input, choose whether to reuse it or run without input.
Follow the logs. Use the drawer to watch the flow and step statuses. Select a log row to expand its execution details.
Example
Section titled “Example”An operator opens Enrich phishing alerts, filters previous runs to Failure, and inspects the latest webhook run. After changing a field mapping, they run the flow again and follow Normalize alert fields in the live Logs drawer.
Keep in mind
Section titled “Keep in mind”- Common HTTP-style errors in step results include unauthorized (401), forbidden (403), not found (404), timeout, and invalid input. Check the vendor API docs for the integration when the message is unclear.
- The flow settings also have a Run logs section for retention and redaction. That controls stored execution data; it is not the run list in the Logs drawer.
- If you cannot interpret an error, copy the message and the step name when you contact support.