

Paris
Analytics 📊
Section titled “Analytics 📊”Ref: #1714, #2127
Exciting News! We’ve just launched our new analytics dashboard. Now, you can easily dive into the comprehensive statistics of your playbooks: from their runs, distributions, successes, and failures to the specific triggers that initiate them.
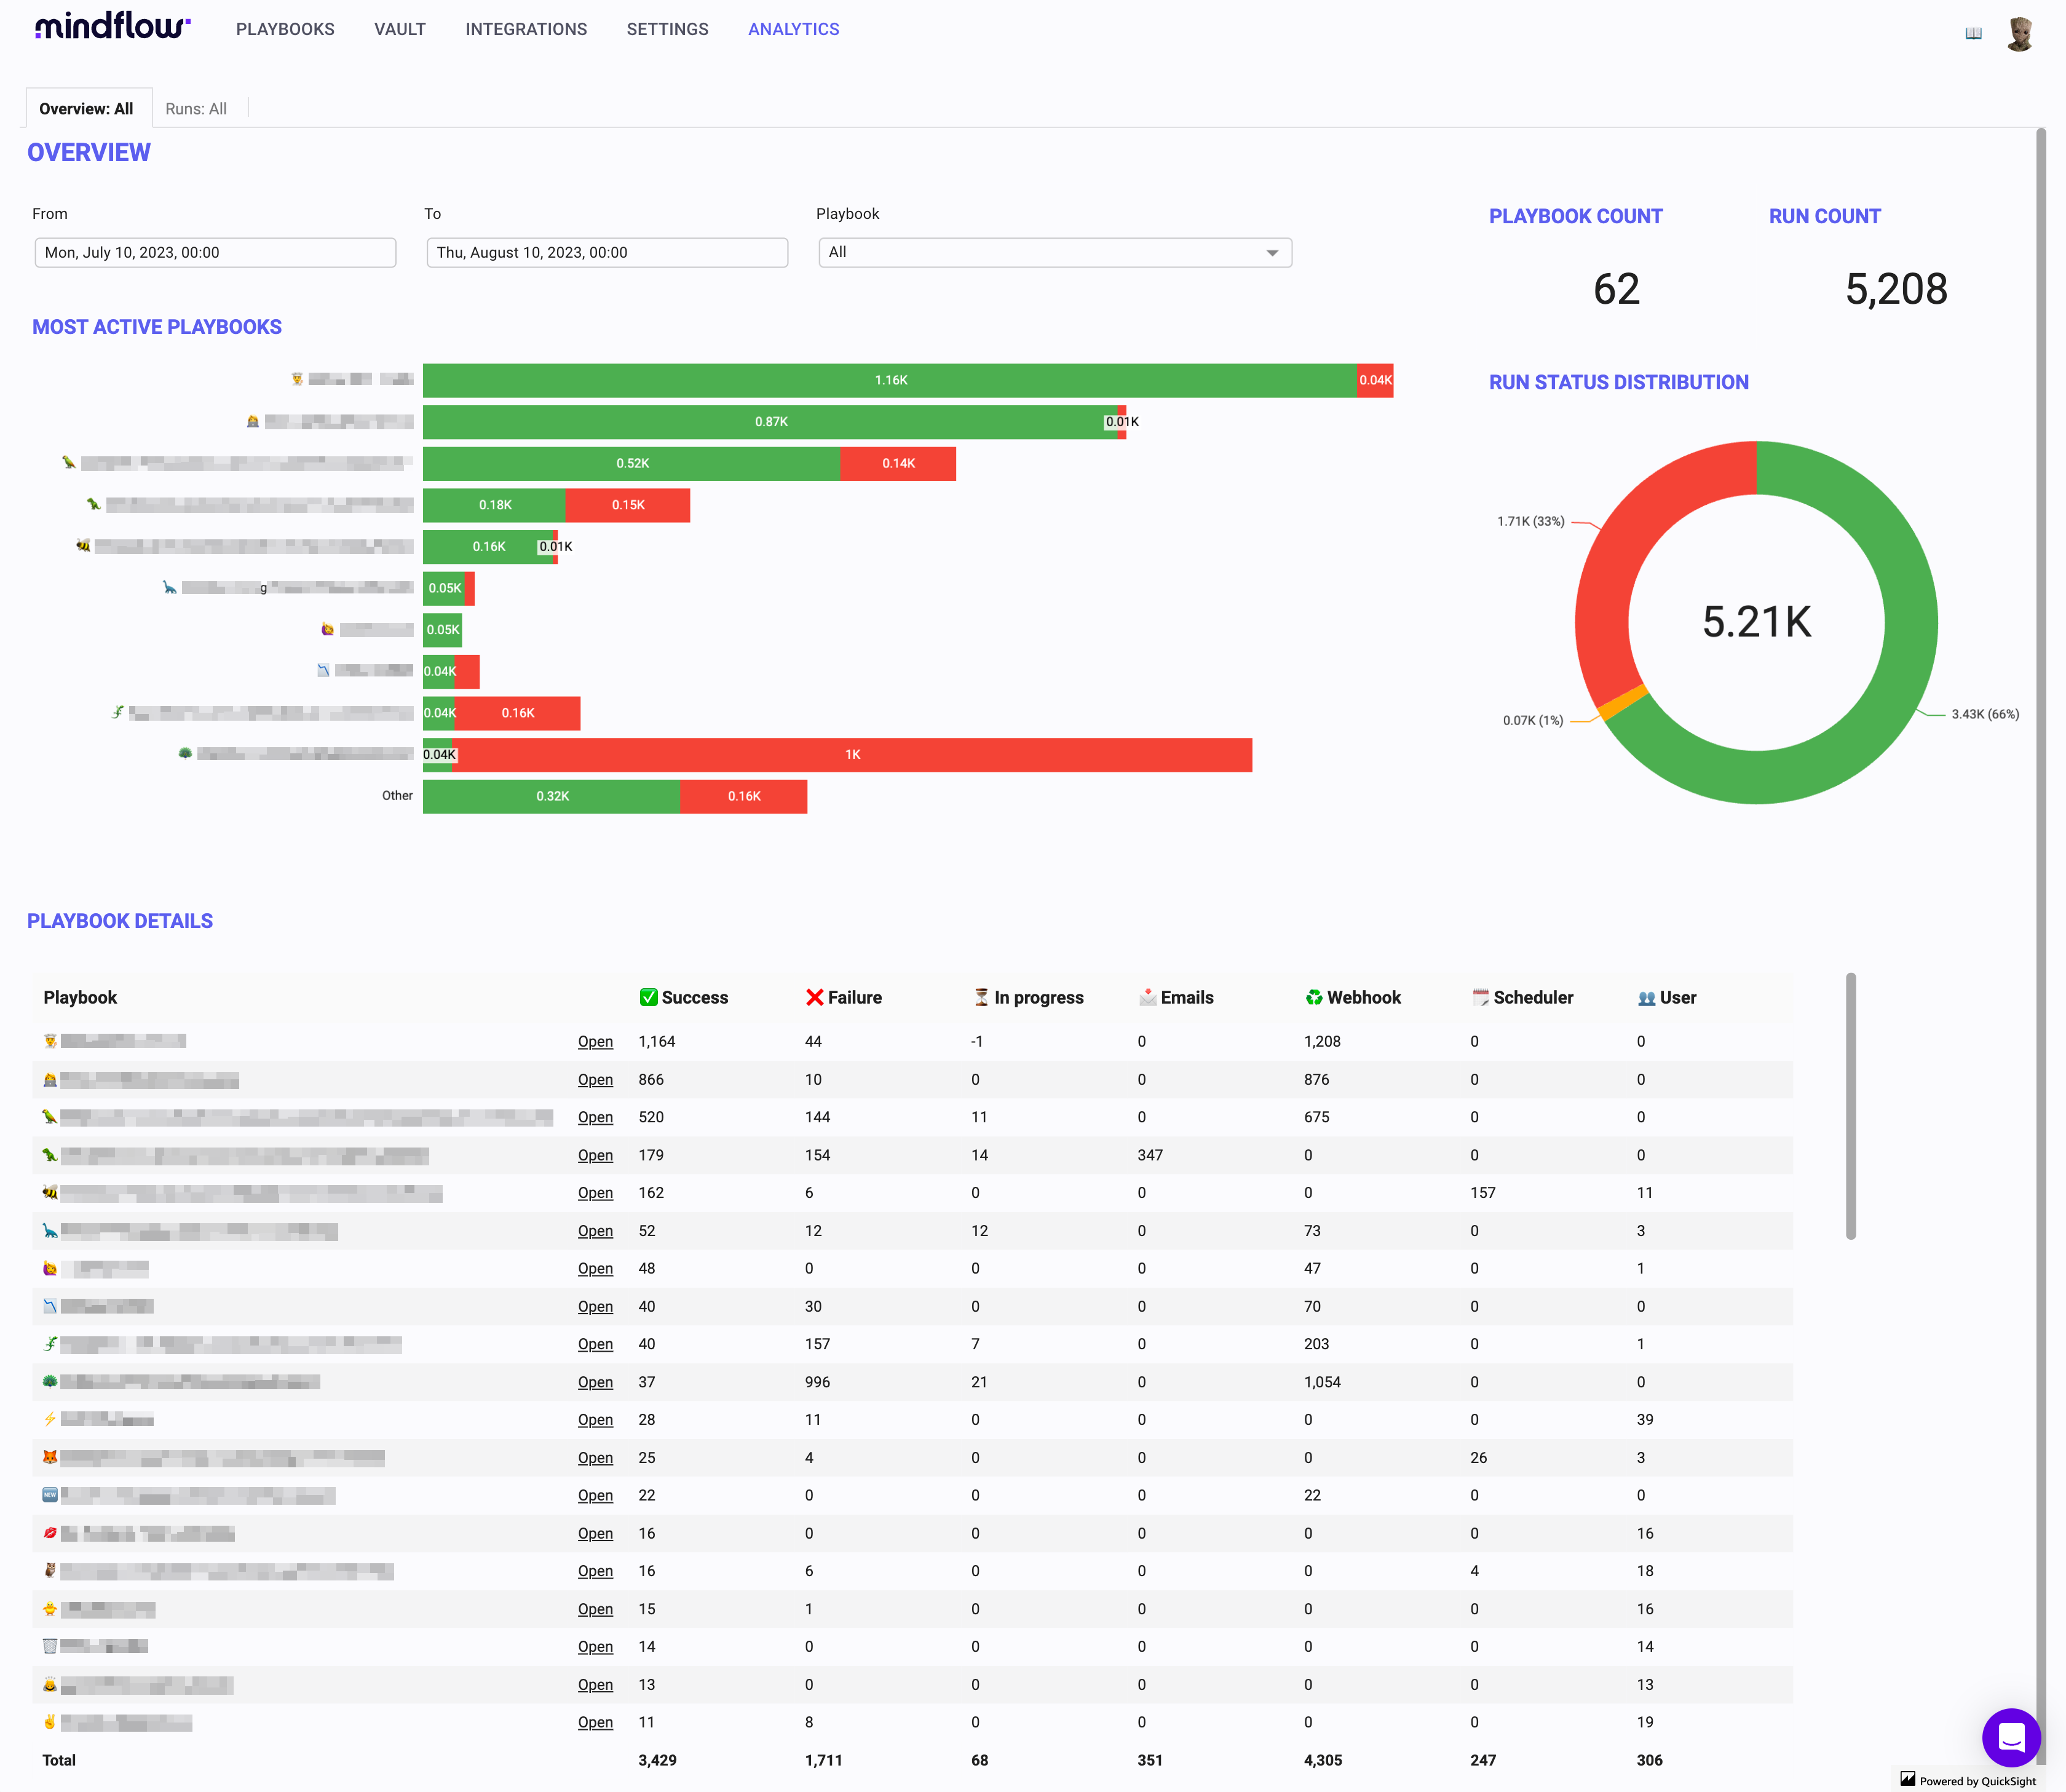
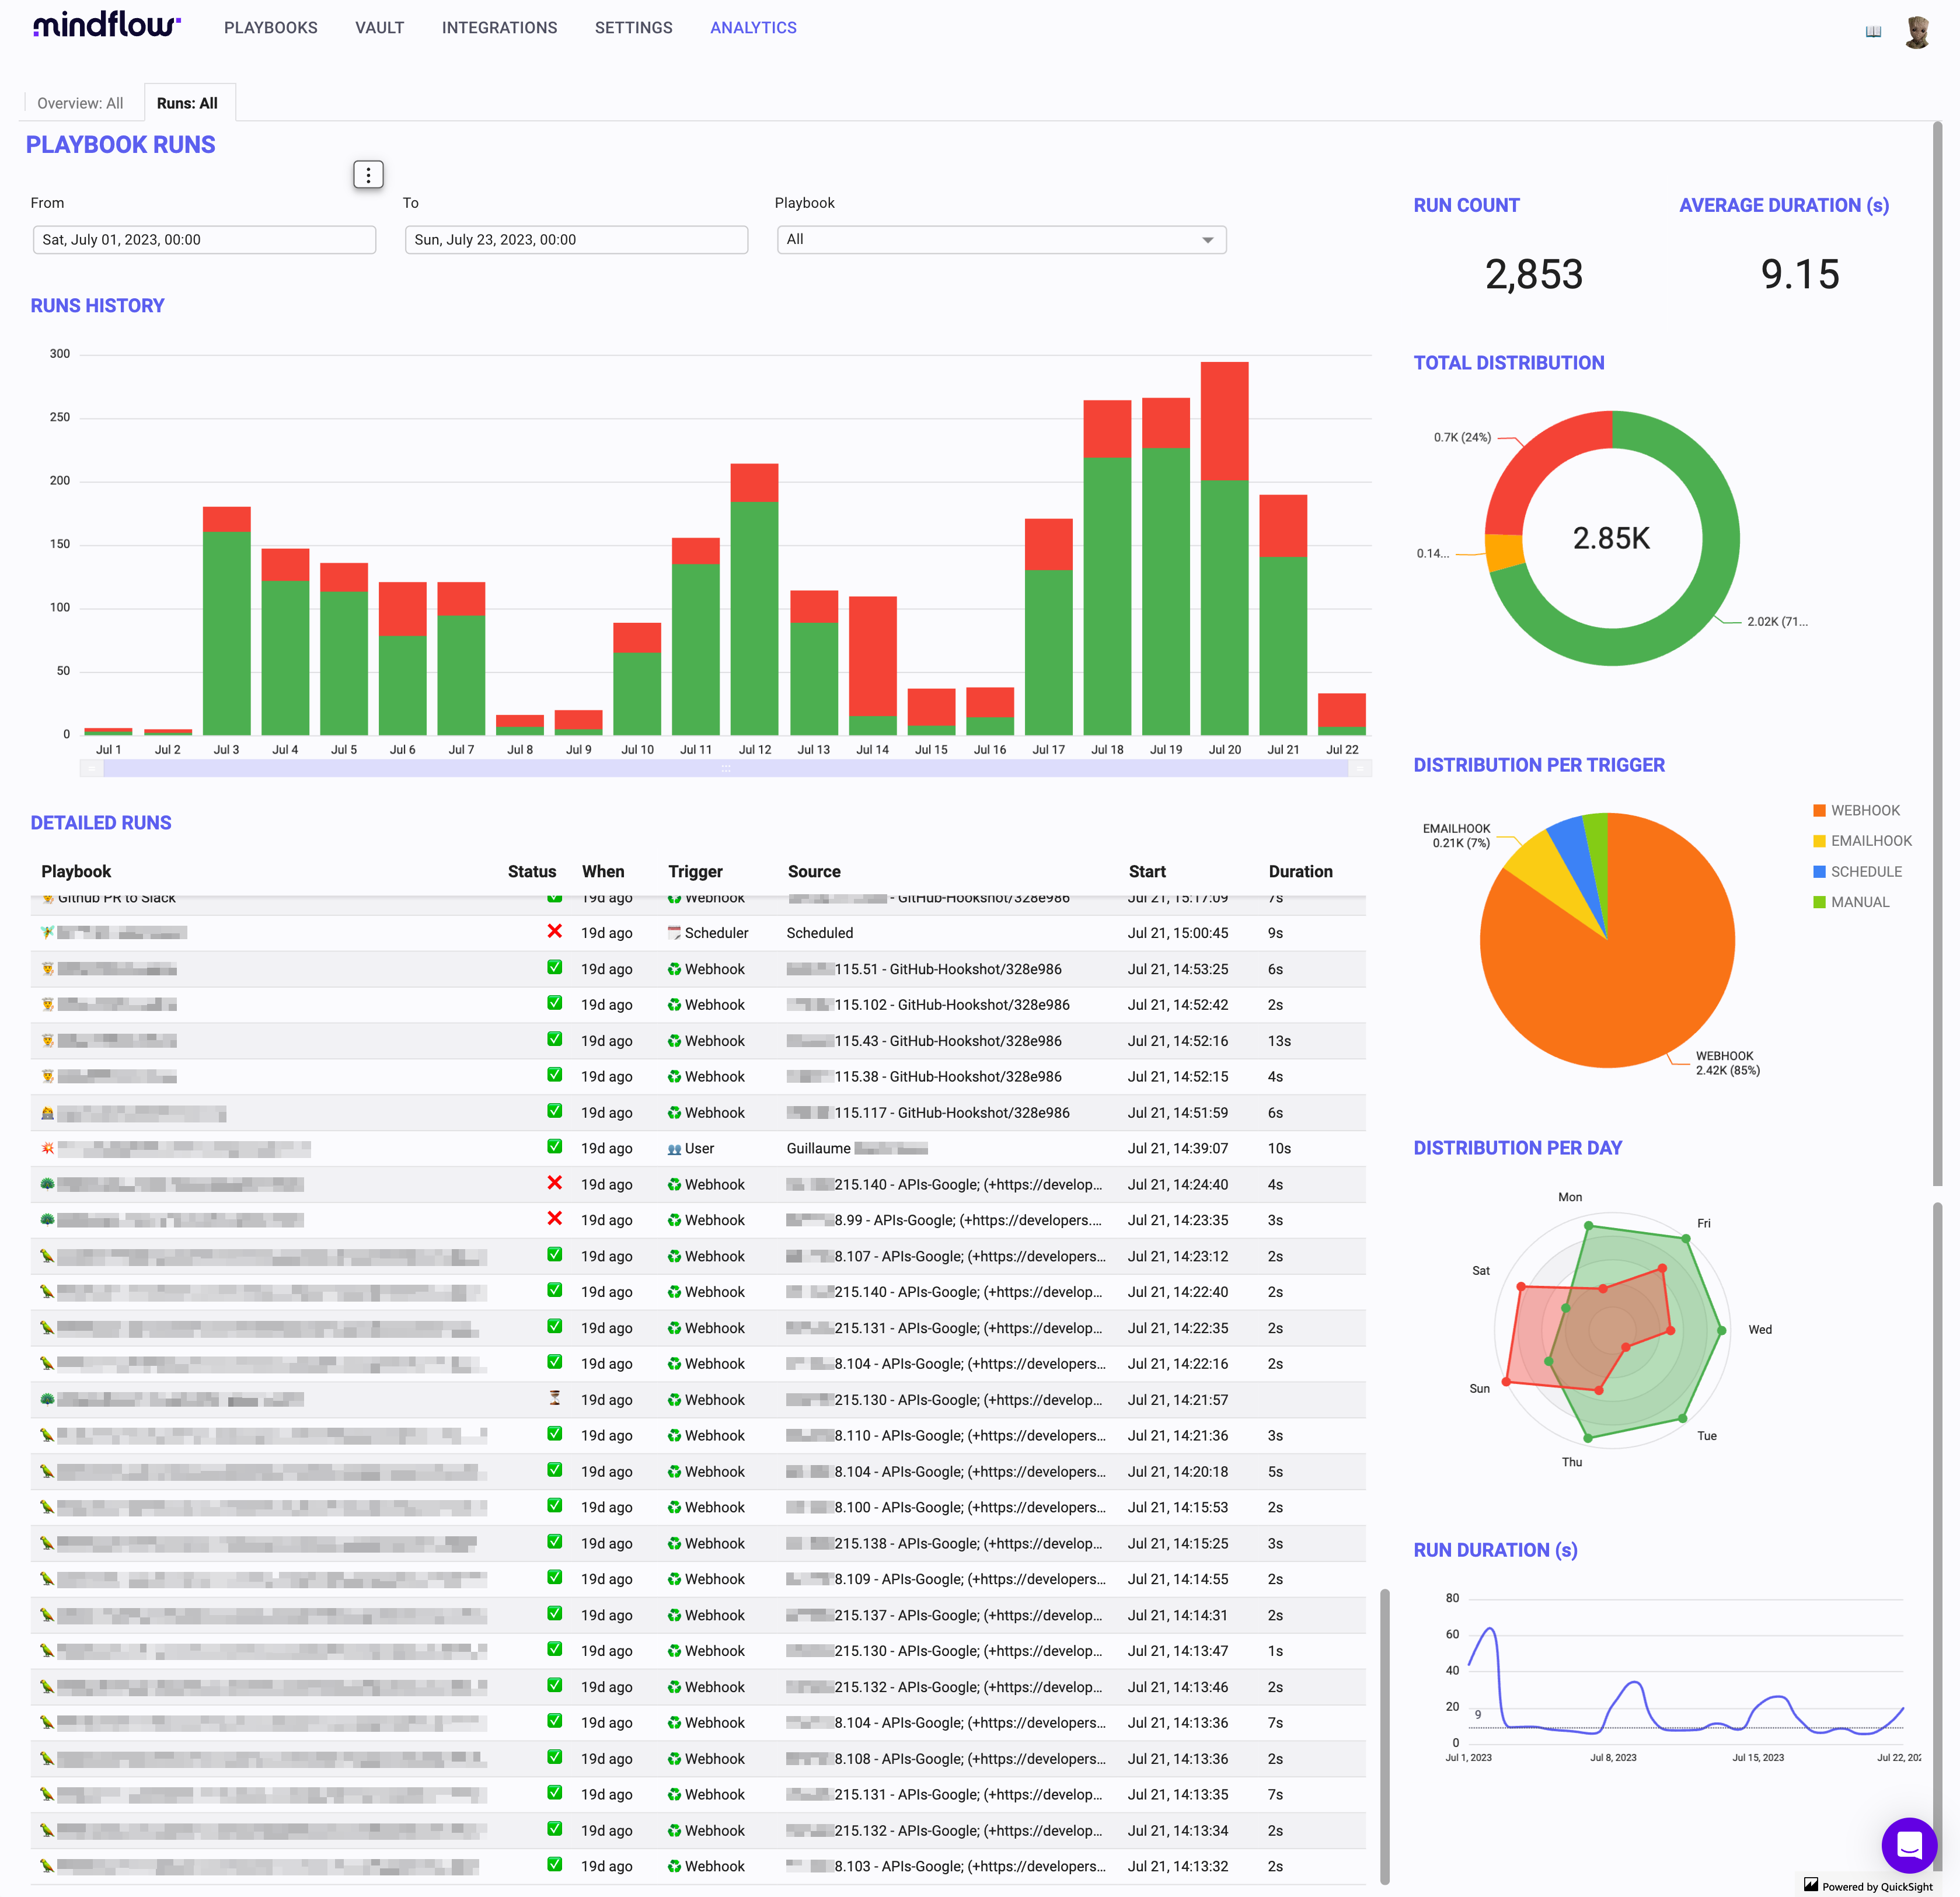
Plus, you can fine-tune your view by filtering between any two dates. It’s an insightful summary that showcases the value of Mindflow at a single glance. Ready to get a clearer picture of your processes? Dive in! 🔍
Additional notes:
- You need to be administrator to view analytics (we may offer fine-grained permissions later).
- Dates are in UTC format.
- To paginate tables (ex: list of playbooks), you need to click the table first in order to display the navigation buttons.
Bugs fixed 🐞
Section titled “Bugs fixed 🐞”- Audit logs not showing (#2145)
- Note styles malfunction (#2103)
- Data picker and log viewer text overflow issues (#2046)
- Pasting steps misaligned with cursor (#1937)
- Some HTTP methods lack logos (#2003)
- For Each steps mismanage variable reassignment (#2153)
- Required data pill rejects empty string (#2149)
- Quick workspace creation results in visual errors (#1068)
- Context-specific logos missing (#1719)
- Playbook resumes only with webhook body present (#2124)